
Product overview
See what changed. Understand what needs review.
Revenue Rounds brings veterinary financial and operating context into connected views. Use the same reporting period to review the signal and its source.
A guided look at the product.
All screens below come from the product code, rendered with synthetic data. Figures illustrate the interface; they are not customer results. Target and benchmark labels are fixture values, not validated veterinary benchmarks. Open any screenshot at full size for detail.
01 / Revenue and collections
Are billed revenue and receivables moving together?
View: financial overview brings revenue, margin, average transaction value, and A/R context together.
Interpretation: the sample shows $126,840 in billed revenue and $17,820 in A/R. A/R is an outstanding balance, not the difference between production and cash collected.
Follow-up: compare reporting ranges and review receivable aging with your bookkeeper. Confirm payment timing before deciding what the movement means.
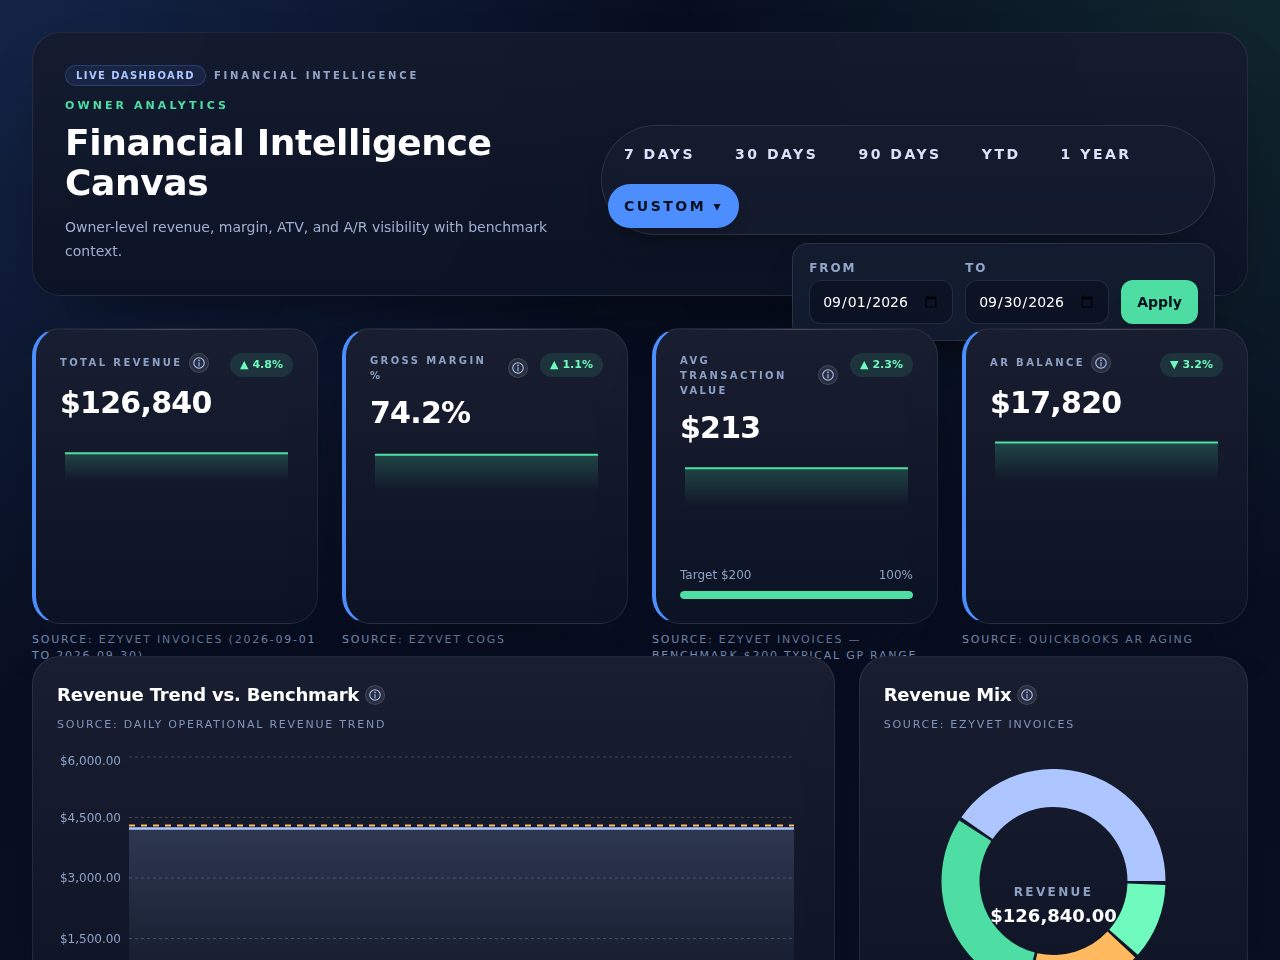
September 1–30, 2026 · synthetic data. Revenue +4.8% and A/R −3.2% compare with the preceding period in this fixture. Lower A/R is marked favorable; it does not establish causation.
Open full screenshot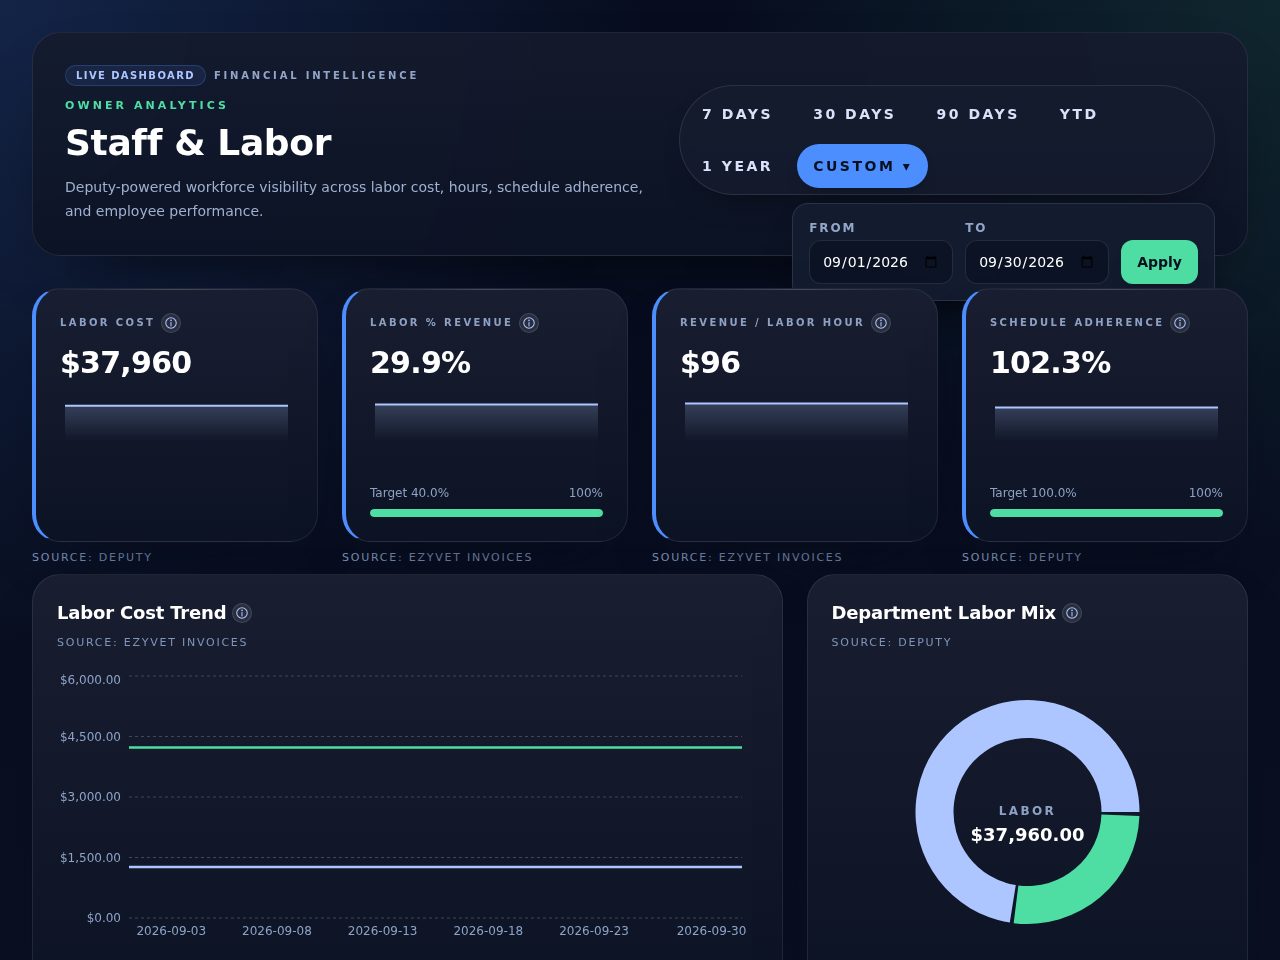
September 2026 · synthetic data. Labor cost is $37,960, or 29.9% of sample revenue. Labor views require suitable source data and pay rates.
Open full screenshot02 / Labor context
Is staffing cost changing with activity?
View: labor cost, revenue per labor hour, hours, and scheduled versus actual time.
Interpretation: a higher cost ratio can reflect timing, workload, or incomplete pay-rate coverage. Read the denominator and period before judging it.
Follow-up: review hours, missing rates, and staffing mix with the practice manager. Deputy and other limited connections need setup review.
03 / Exceptions and freshness
Can you rely on this reporting window?
View: last-update context, stale-data notices, and category mapping review.
Interpretation: a stale dashboard can show the last published figures while a refresh runs. A normal-looking value does not prove that its inputs are current.
Follow-up: resolve connection or mapping issues, then review refreshed figures. Refresh schedules and a weekly owner-review habit are different things.
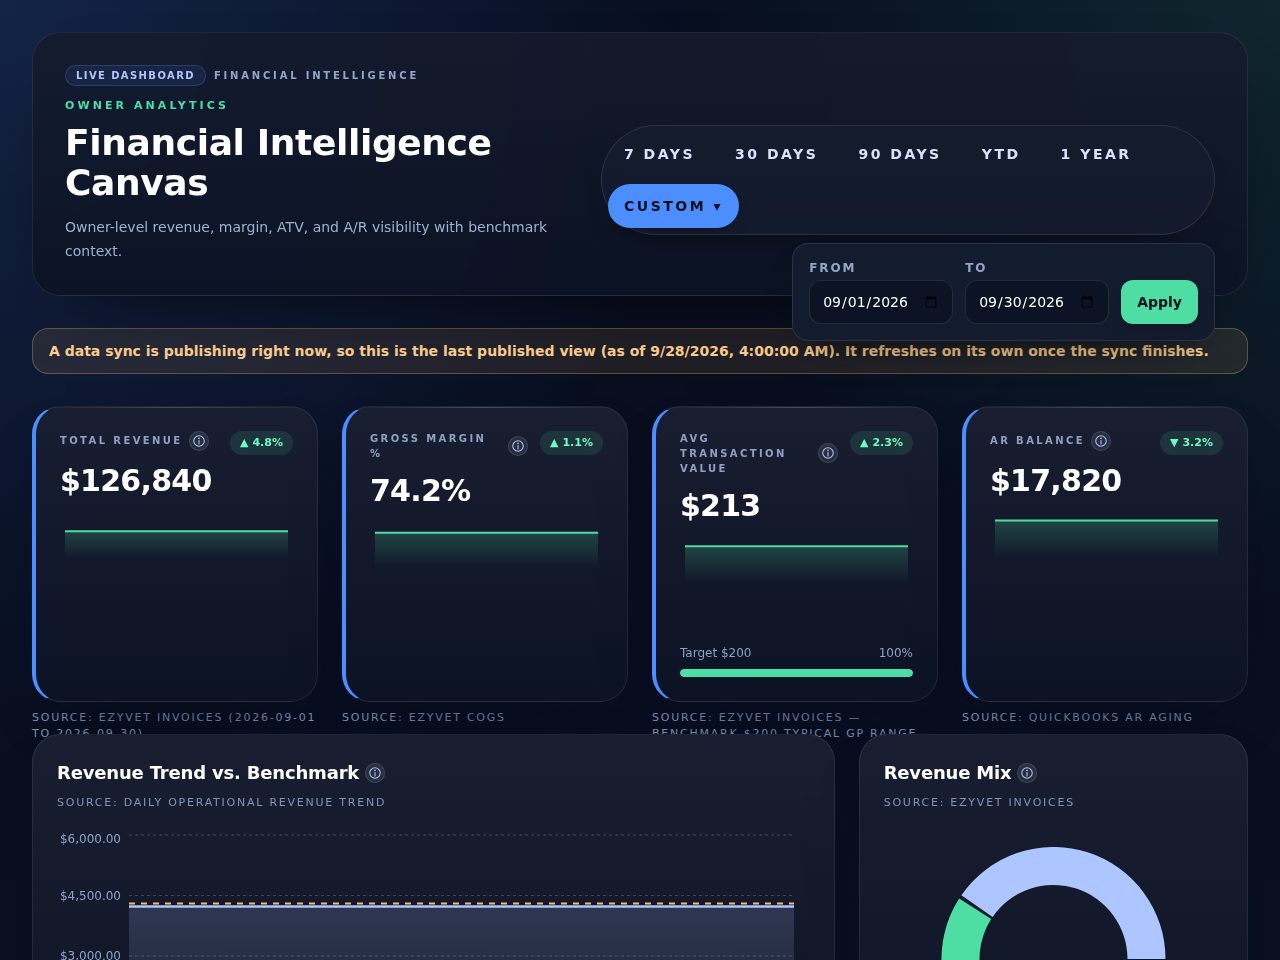
Actual stale-state interface · synthetic sample data. Never interpret the warning as a live connection-health claim.
Open full screenshotUseful for owners and the people doing the review.
01
Practice owners
Bring source-aware questions to a financial review instead of reconciling isolated screenshots.
02
Practice managers
Use labor, activity, and mapping context to prepare follow-up questions for the owner. Financial analytics access depends on assigned role.
03
Groups and advisors
Discuss location scope and access during setup. Confirm permissions and supported views before choosing a group workflow.
- Does this replace accounting software?
- No. Accounting records and professional advice remain part of your review. Revenue Rounds adds operating and source context around the numbers.
- Will it work with my systems?
- ezyVet and QuickBooks Online have implemented connection paths that need a practice-specific setup check. Xero requires current connection verification. Native Gusto is unavailable in the current interface; ADP requires provider approval and production provisioning. Check integrations before choosing.
- How often does data refresh?
- Refresh is scheduled by source. A scheduled run is not a guarantee that every view has current data. Source status and dashboard freshness should be checked before a financial review.
- How is pricing handled?
- Pricing is custom. Describe your practice and required connections so the conversation can cover subscription scope, setup, and support before you commit.
Next step
Bring your questions. We’ll walk through the numbers.
See the product, discuss your systems, and understand what setup would involve. This request starts a conversation; it does not book a calendar slot.